
You need to update a budget or compare sales figures, but the report arrived as a PDF. Retyping every row adds work before you can even start calculating. Convert PDF to Excel to move that information into a workbook.
This guide shows you how to convert PDF to Excel with Recastia and organize the resulting cells for sorting, formulas, and future reports.
Key Takeaways
- Choose Excel when you need to calculate with figures or organize rows from a PDF.
- Recastia creates a downloadable XLS workbook and provides an online sharing option.
- A converted workbook can contain separate worksheets and spacing inherited from the PDF layout.
- Arrange one record per row, check numeric data types, and remove repeated page headers before adding calculations.
- Keep product codes as text when leading zeros matter.
What Is Recastia?
Recastia converts PDFs into several formats through its PDF to Document tool. Choose Excel for spreadsheet work, Word for revising paragraphs, PowerPoint for slides, or Image for page images. The PDF to Document guide explains when to use each format.
Excel works well for sales reports, price lists, schedules, and other documents containing rows and figures. If you mainly need to rewrite text, use the PDF to Word guide instead.
How to Convert PDF to Excel With Recastia
Start with the original PDF, especially when you have a digital copy with selectable text. Clear headings and aligned columns give you a more practical starting point for spreadsheet work than a screenshot of a report.
- Upload the PDF
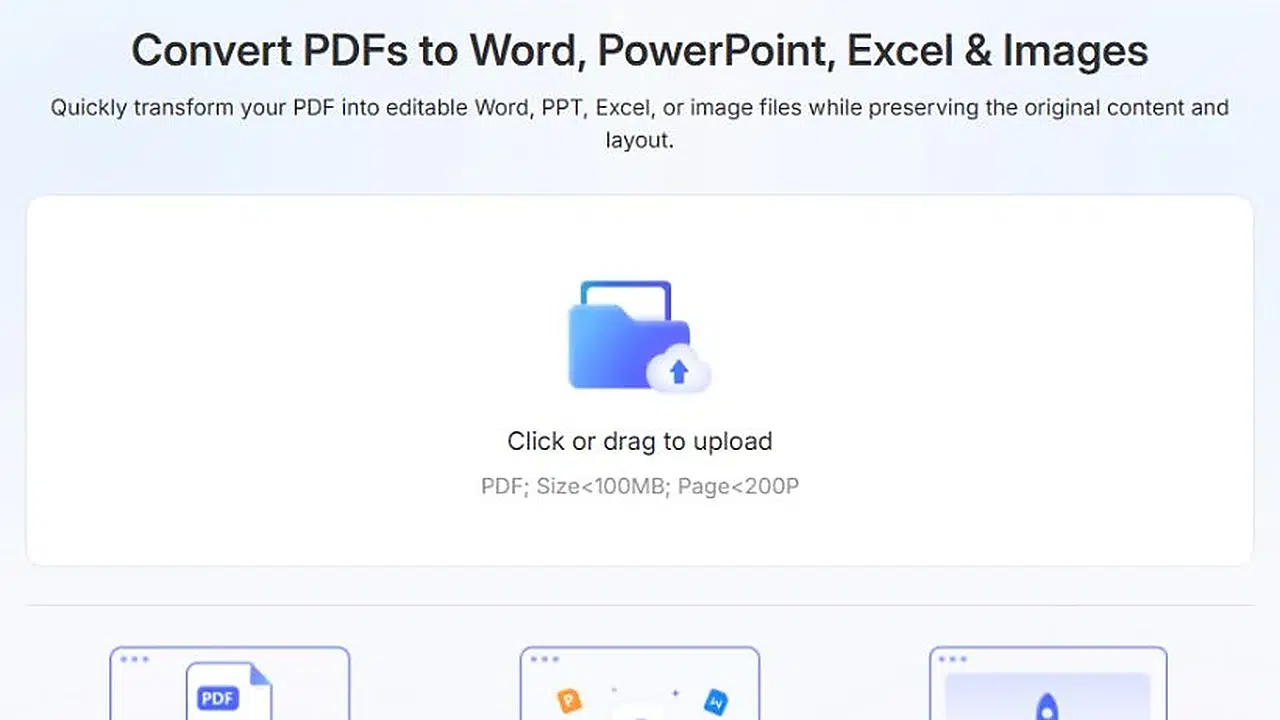
Open the PDF to Document converter and upload your file. Use the complete report if you need to compare figures across its pages. The upload screen shows the file and page limits that apply to your account.
- Select Excel and Convert
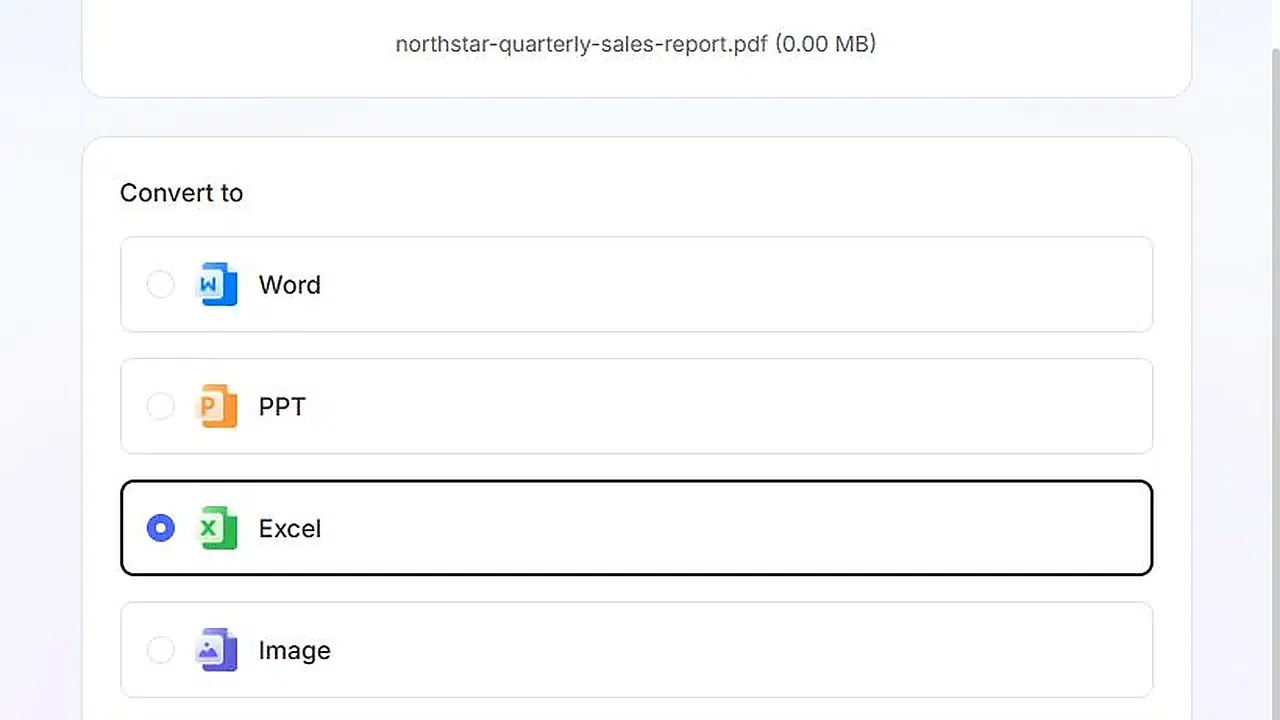
Choose Excel as the output format, then select Convert. This produces a workbook for editing the extracted content. It does not recreate the formulas or reporting model that may have existed before the source document became a PDF.

- Download or Share the Workbook
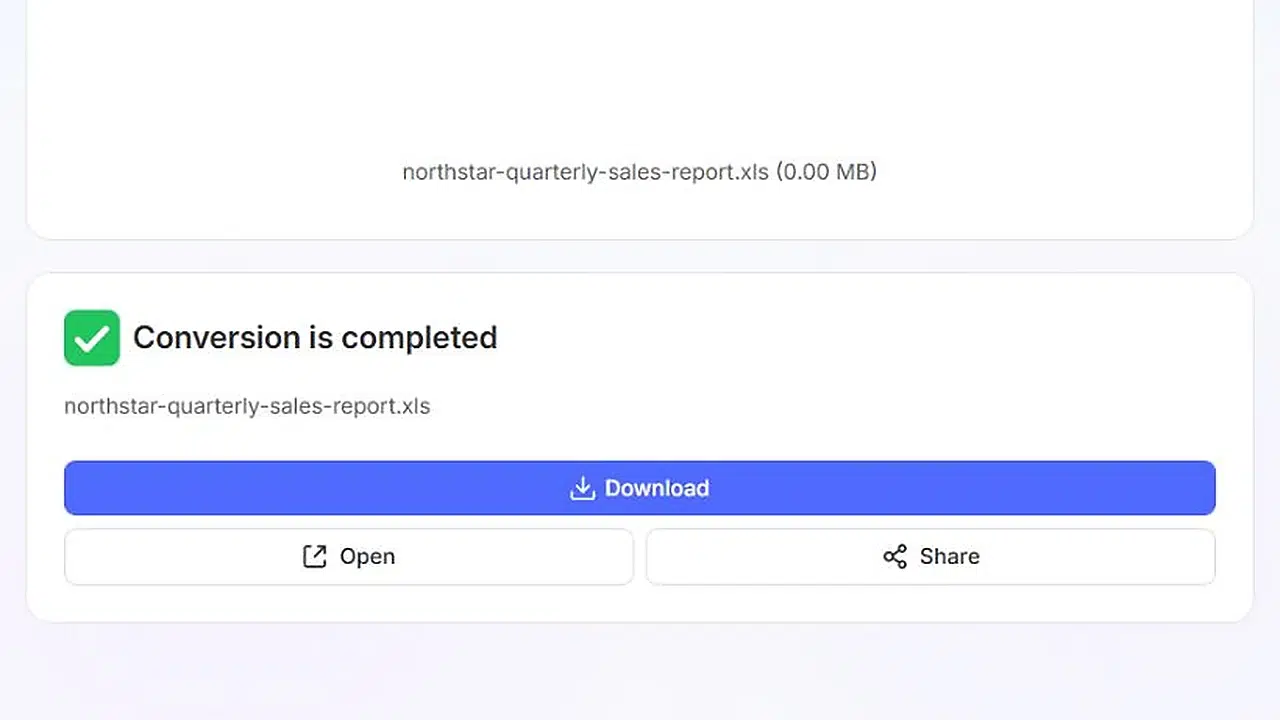
Download the XLS file and open it in Excel to organize the cells. You can also use Open to view the result online, or Share to get a hosted link and QR code. Download a working copy when you need to add calculations or combine the data with another workbook.
Organize the Converted Rows Before Calculating
A PDF arranges information for a page. Excel needs a consistent data range. A title above the table, a blank column between figures, or a repeated heading on the next page can interrupt that range after conversion.
Look across the workbook’s sheets before combining anything. Rename sheets to describe their contents, such as Regional Sales or Product Prices. When one table continues across several PDF pages, bring the matching rows together under one set of column headings. Keep unrelated tables separate.
Use one record per row. For example, a monthly sales table might have Month, Region, Product, and Revenue columns. Each row should identify one month’s sales for one product in one region. Keep an existing subtotal outside the data range so a new sum does not count it twice.
Remove page titles and repeated header rows from the middle of the table. Do not automatically remove rows just because their amounts match: two different orders can have the same value. A date, order number, or other identifier determines whether they are actually duplicates.
Fix Values That Excel Cannot Calculate
A cell can look like a number while Excel stores it as text. Formatting that cell as currency changes its appearance; it does not always convert the underlying value. Before building formulas, confirm that the amount columns contain numeric values.
| What You Find | What to Do | Why It Matters |
| Amounts stored as text | Convert the amounts to numbers, then apply currency formatting | Formulas need numeric values |
| Repeated headers between records | Keep one header row above the data | Filters should operate on records, not page labels |
| Dates with an unclear day/month order | Compare them with the source before converting | 03/04 can represent two different dates |
| Product codes beginning with zero | Store the codes as text | 00124 and 124 may identify different records |
| A total included below the source rows | Move it outside the range used for the new total | Summing both counts the same figures twice |
Preserve the meaning of percentages as well as their appearance. A numeric value of 0.15 displayed as a percentage means 15%. Applying percentage formatting to the number 15 produces 1,500%, so compare the result with the PDF before using it in a calculation.
For identifiers, follow Microsoft’s guidance on keeping leading zeros and large numbers. If a zero has already disappeared, changing the cell format to Text will not reconstruct it. Use the original document to restore the complete code.

Use the Data in Your Reporting Workbook
Once the rows and data types are consistent, turn the range into an Excel table. Filters can isolate a region or product, and sorting can put dates or amounts in order. Include the complete table when sorting so each amount stays beside its matching label.
Add calculations beside the imported values. For example, keep Actual and Budget in their own columns and calculate the difference in a third column. This leaves both source figures available when someone asks how the result was calculated.
For a recurring report, keep a separate workbook containing your formulas and charts. Put each new set of cleaned values into the same columns, with a Month or Period column to distinguish reporting periods. You can then compare months without rebuilding the analysis each time a PDF arrives.
FAQ
No. A PDF usually contains the displayed figures rather than the spreadsheet formulas behind them. Add the calculations you need in Excel after arranging the imported values.
Recastia’s Excel conversion provides an XLS download. Open it in Excel and use Save As if you need an XLSX working copy. Renaming the file extension alone does not convert the workbook format.
Yes, when the columns describe the same information. Align the column names and data types, keep one header row, and add the records beneath it. Keep separate tables apart if they use different units or describe different things.
A chart visible in a PDF is not the original Excel chart with its linked data range. If you need to change its values or design, use the underlying figures to build a new chart in Excel.
PDF pages use positioning and spacing to arrange content, while a spreadsheet stores information in cells. Conversion can carry over extra spacing, repeated headings, or separate page sections. Organizing those cells makes the workbook suitable for sorting and calculations.
Conclusion
Convert PDF to Excel when you need to work with the figures in a report. Recastia provides the workbook; arranging its rows and data types makes those figures usable in your analysis.
After you convert PDF to Excel, keep the source values separate from new formulas and retain the PDF for reference. You can then update the report without retyping its tables.
Bring Your PDF to Life With Recastia
Create, customize, and share your content in a more engaging way.